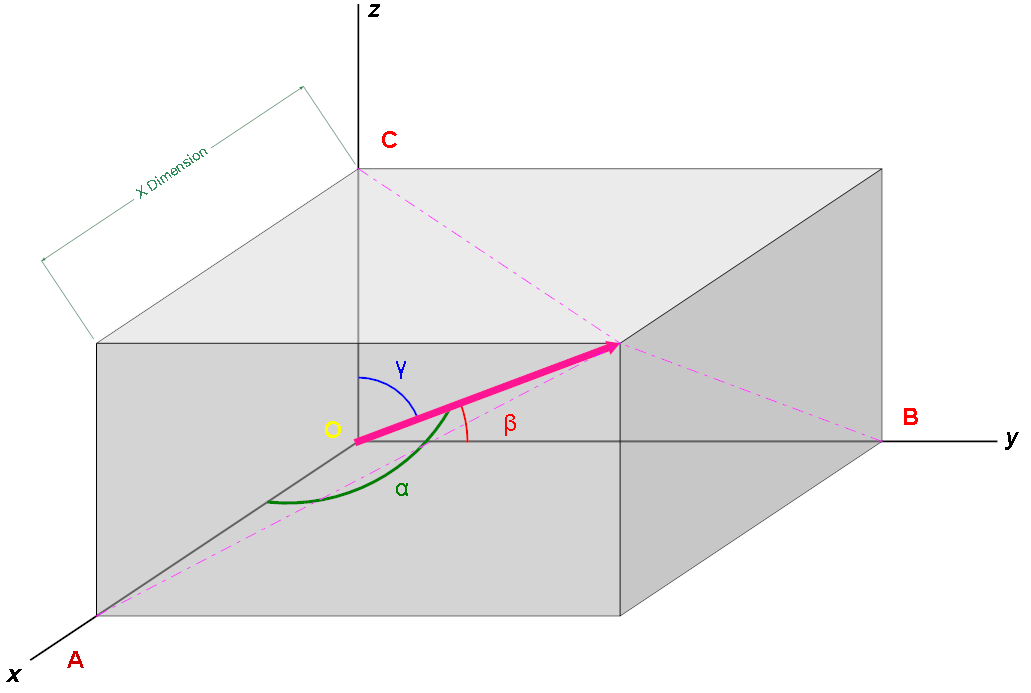
Click Help→Samples→  to open the Diagram sample project.
This project is a simple diagram that shows you the graphical powers of AutoTRAX DEX.

The Diagram Sample Project
What is a Graphical Diagram
A graphical diagram is a type of visual representation that uses symbols, shapes, lines, and colors to illustrate concepts, ideas, processes, or relationships between different elements. Graphical diagrams can range from simple charts to complex maps and network diagrams, depending on the nature of the information being represented.
Some common types of graphical diagrams include:
•Flowcharts: These are used to illustrate a sequence of operations or a work-flow. They often include symbols like rectangles, diamonds, and arrows to represent different stages, decisions, and the flow of information.
•Bar charts and Histograms: These are used to represent numerical data or the distribution of data sets.
•Pie charts: These are used to represent proportions of a whole.
•Venn Diagrams: These are used to illustrate the relationships between different groups or sets, typically showing areas of overlap between them.
•Mind maps: These diagrams are used to visually organize information, typically around a single concept or problem, with related ideas branching out from the central topic.
•Organizational Charts: These diagrams represent the structure of an organization and the relationships and relative ranks of its parts and positions/jobs.
•Network diagrams: These are used in information technology to illustrate the connections between different devices in a network.
•Process diagrams: These can include diagrams like PFD (Process Flow Diagram) and P&ID (Piping and Instrumentation Diagram) used in engineering and manufacturing to illustrate the stages of a process.
These graphical diagrams are widely used in various fields such as business, education, engineering, and science, because they can communicate complex information in a way that's easy to understand at a glance.