To add a chart to a schematic:
1.Click on the ![]() button in the Simulate->Instruments button group in the Ribbon Menu.
button in the Simulate->Instruments button group in the Ribbon Menu.
2.Move the mouse inside the viewport of the schematic.
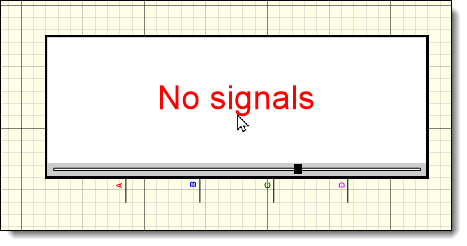
3.As you move the mouse, a chart will follow as shown below. Left click the mouse to end moving the oscilloscope.

A Chart Following the Mouse Cursor

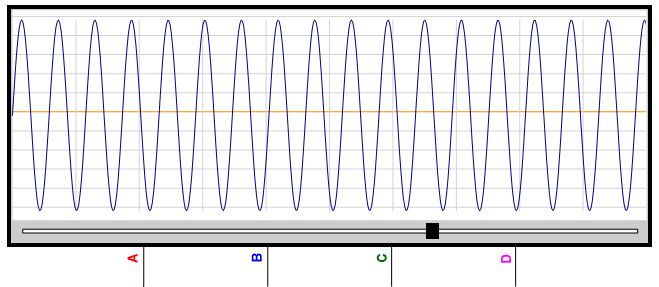
A Chart
Chart Instrument Properties Editor