Click Help→Samples→  to open the Flow Chart sample project.
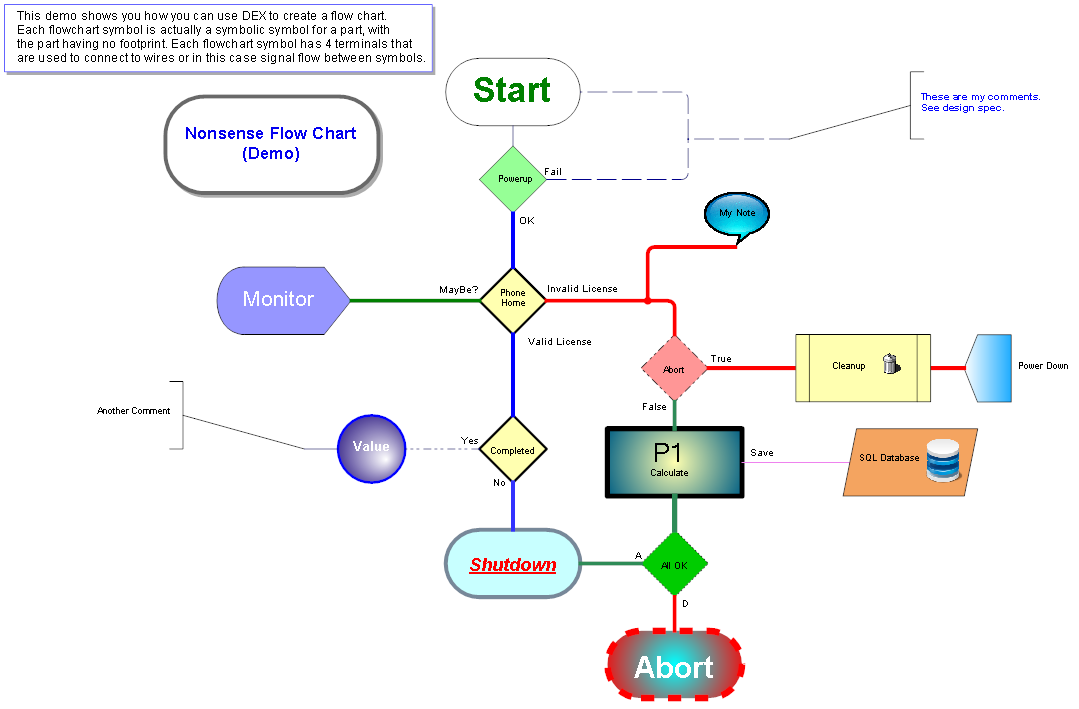
With AutoTRAX DEX you can draw flowchart diagrams such as the one below. The flowchart design project shows you the example flowchart you see below.

The Flowchart Design Sample Project
Flowcharts
A flowchart is a type of diagram that represents a work-flow or process. It shows the steps as boxes of various kinds, and their order by connecting them with arrows. This diagrammatic representation illustrates a solution model to a given problem. Flowcharts are used in analyzing, designing, documenting or managing a process or program in various fields.
Here are some common elements of a flowchart:
•Start/End Symbols: These are typically represented as circles or rounded rectangles and signify the beginning or end of a process.
•Process Step: Represented as a rectangle, this shows a task or operation that needs to be done.
•Decision Point: This is represented as a diamond shape and indicates a point where a decision is required, typically a Yes/No question or True/False condition.
•Flow Lines/Arrows: These show the direction of the process flow.
•Input/Output: This symbol (often a parallelogram) represents information entering or leaving the process.
•Predefined Process: Represented by a rectangle with double-struck vertical edges, this symbol is used to represent a sequence of operations that are defined elsewhere.
•Flowcharts are useful for understanding complex processes, designing and optimizing processes, and ensuring that processes meet certain standards. They're often used in business and engineering disciplines, but can also be useful in other fields. The visual nature of flowcharts makes them easy to understand, and they're a common tool for teaching and explaining processes.